

Imagine you’re captaining a ship through unpredictable waters. One moment, the sun shines brightly, and your sails catch a perfect breeze; the next, a tempest brews, threatening to toss you off course. That’s the stock market in a nutshell—thrilling yet treacherous. As an experienced share market analyzer, I’ve seen fortunes made and lost in the blink of an eye, all thanks to something called market risk. But what is market risk, exactly? Why should you care? And how can you steer your investments to safer harbors?
Market risk, often dubbed systematic risk, is the potential for your investments to lose value due to broad economic forces beyond your control—think interest rate shifts, geopolitical chaos, or a sudden crash in stock indices. Unlike company-specific risks (say, a CEO scandal), market risk affects the entire financial ecosystem. In this article, we’ll unravel its mysteries, explore tools like the Sharpe Ratio and beta, and show you how to analyze it like a pro using bestportfolio.us, a free stock market analyzer that harnesses beta values to optimize your portfolio. Ready to dive in? Let’s set sail!
Decoding Market Risk: What’s at Stake?
Market risk isn’t just a buzzword—it’s the heartbeat of investment volatility. It’s the chance that your stocks, bonds, or entire portfolio takes a hit because of macroeconomic tidal waves. Picture this: a central bank hikes interest rates, and suddenly, stock prices plummet. Or a global pandemic sparks panic selling. These aren’t isolated incidents; they’re market risk in action.
Types of Market Risk—Know Your Foes
Market risk comes in several flavors, each with its own sting:
- Equity Price Risk: The rollercoaster of stock prices. When the S&P 500 dips, your shares might follow suit.
- Interest Rate Risk: Rising rates can sink bond values and rattle equity markets.
- Currency Risk: If you’re trading internationally, a fluctuating dollar can erode profits.
- Commodity Risk: Oil prices spike, and your energy stocks soar—or crash.
These risks don’t discriminate—they hit every investor, from Wall Street titans to weekend traders. That’s why understanding them is your first line of defense.
Why Market Risk Matters to You
Why lose sleep over market risk? Simple: it dictates your returns. Ignore it, and you’re sailing blind. Master it, and you’ll spot opportunities amid the chaos. Tools like bestportfolio.us make this easier by analyzing your portfolio’s exposure to these risks using beta—a measure of how much your stocks move with the market. More on that later!
Share Risk: Spreading the Load or Doubling the Trouble?
Ever heard the saying, “Don’t put all your eggs in one basket”? That’s share risk in a nutshell. When you invest in stocks, you’re betting on individual companies—but market risk ties them all together. A diversified portfolio might cushion the blow, but it won’t shield you entirely from a market-wide crash.
Diversification vs. Systematic Risk
Diversification tackles unsystematic risk—think a company’s bad earnings report. But market risk? That’s systematic. No matter how many stocks you own, a recession can drag them all down. The key is balancing your shares to minimize damage while maximizing gains. Enter bestportfolio.us, which calculates your portfolio’s beta to reveal its market sensitivity. A beta of 1 means your portfolio mirrors the market; above 1, it’s more volatile; below 1, it’s steadier.
Real-World Example: The 2020 Crash
Remember March 2020? The S&P 500 plummeted over 30% as COVID-19 gripped the globe. Diversified or not, most portfolios bled red. That’s market risk flexing its muscles—no stock was immune. Analyzing share risk with tools like bestportfolio.us could’ve helped you adjust your sails before the storm hit.
Sharpe Ratio: Measuring Reward Against the Storm
How do you know if the risks you’re taking are worth it? Enter the Sharpe Ratio—a beacon in the fog of market uncertainty. Developed by Nobel laureate William Sharpe, this metric tells you how much extra return you’re earning for each unit of risk.
The Formula Unveiled
Here’s the magic equation:
Sharpe Ratio = (Portfolio Return - Risk-Free Rate) / Standard Deviation
- Portfolio Return: Your total gains (say, 12% annually).
- Risk-Free Rate: What you’d earn from a “safe” asset like a U.S. Treasury Bill (e.g., 2%).
- Standard Deviation: A measure of your portfolio’s volatility (e.g., 15%).
Let’s crunch some numbers. If your portfolio returns 12%, the risk-free rate is 2%, and the standard deviation is 15%, your Sharpe Ratio is:
(12 – 2) / 15 = 0.67
A ratio above 1 is good; above 2 is stellar. At 0.67, you’re earning decent returns, but the risk might outweigh the reward.
H3: Why It’s a Game-Changer
The Sharpe Ratio cuts through the noise. A high return with wild swings? Not impressive. Steady gains with low volatility? That’s the sweet spot. Pair this with bestportfolio.us, and you’ll see how your portfolio stacks up against market benchmarks—free and fast.
Risk-Free Rate: Your Safe Harbor Benchmark
The risk-free rate is your anchor—the return you’d get with zero risk. Typically pegged to short-term U.S. Treasury Bills (around 2-4% lately), it’s the baseline for judging riskier investments.
H3: Why It’s Crucial
Without a risk-free rate, the Sharpe Ratio collapses. It’s the yardstick that says, “You could’ve earned 2% doing nothing—why risk more for less?” As rates rise (like in 2022-2023), the bar gets higher, pushing you to justify every stock pick.
Practical Twist
In reality, “risk-free” isn’t absolute. Treasury yields shift with economic winds. Still, it’s the closest thing to a safe bet, making it vital for tools like bestportfolio.us to calibrate your portfolio’s performance.
Stock Risk Analysis: Taming the Beast
Stock risk analysis is your spyglass into the market’s soul. It’s about dissecting how your stocks behave under pressure—crucial for dodging icebergs.
Equity Price Risk Sensitivity Analysis
How much does a 1% market drop hurt your stock? That’s sensitivity analysis. Beta is your star player here. A stock with a beta of 1.5 falls 1.5% when the market drops 1%. bestportfolio.us cranks out these numbers effortlessly, showing you which holdings amplify market risk.
Stock Risk Ratings
Ratings like beta, volatility, and VaR (Value at Risk) grade your stocks’ riskiness. A high-beta stock (e.g., Tesla at 2.0) is a wild ride; a low-beta pick (e.g., a utility at 0.5) is a snooze. Use bestportfolio.us to rank your portfolio and trim the fat.
Bestportfolio.us: Your Free Market Risk Ally
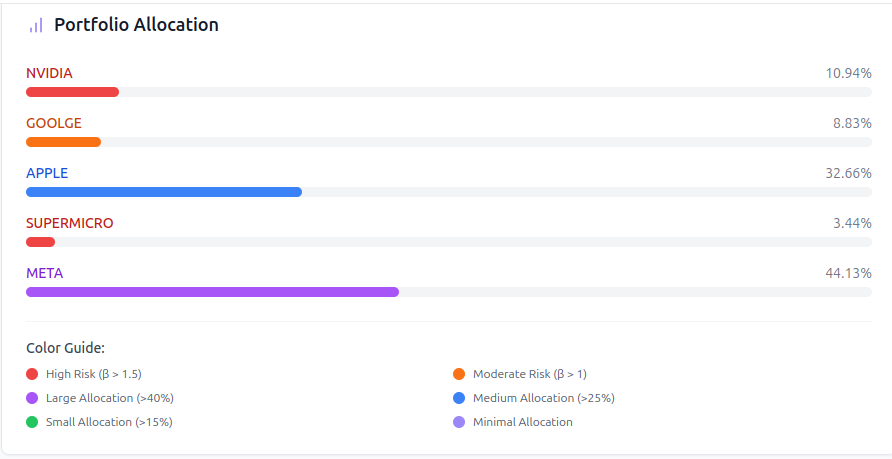
Here’s the kicker: you don’t need a Wall Street budget to analyze market risk. bestportfolio.us is a free stock market analyzer that leverages beta to map your portfolio’s risk profile. Plug in your holdings, and it spits out actionable insights—beta scores, volatility stats, and more—all in seconds.
Why It Shines
- Beta-Driven: See how your portfolio dances with the market.
- User-Friendly: No PhD required—just input and analyze.
- Free: Zero cost for pro-level insights.
Whether you’re dodging equity price risk or fine-tuning your Sharpe Ratio, bestportfolio.us is your co-captain. Try it today and take control of market risk!
FAQ: Your Market Risk Questions Answered
What’s the Difference Between Market Risk and Company Risk?
Market risk hits everything (systematic); company risk targets one firm (unsystematic). Diversification softens the latter, not the former.
How Do I Lower Market Risk?
Hedge with options, lean on low-beta stocks, or use bestportfolio.us to rebalance smartly. You can’t eliminate it, but you can tame it.
is a Negative Sharpe Ratio Bad?
Yes—it means your returns lag the risk-free rate. Time to rethink your strategy.
How Often Should I Check My Portfolio’s Risk?
Monthly works for most. Big market moves? Check sooner with bestportfolio.us.
Conclusion: Master Market Risk, Win the Game
Market risk is the untamed beast of investing—unpredictable, relentless, but conquerable. Armed with tools like the Sharpe Ratio, beta, and bestportfolio.us, you’re not just surviving; you’re thriving. Don’t let the market dictate your fate—analyze, adjust, and sail toward profit. Visit bestportfolio.us today, plug in your portfolio, and start mastering market risk like a seasoned pro. The seas may rage, but your ship will stay steady.
One thought on “What Is Market Risk? A Deep Dive into the Wild World of Investment Uncertainty”